

MASFactory Visualizer
MASFactory Visualizer is the VS Code companion for MASFactory. It aligns graph structure and runtime observability in a single view, so you can preview, debug, and handle human-in-the-loop interactions with consistent mental models.
This page is a quick-start overview. For full details, see: Dev Guide · MASFactory Visualizer.
What it provides
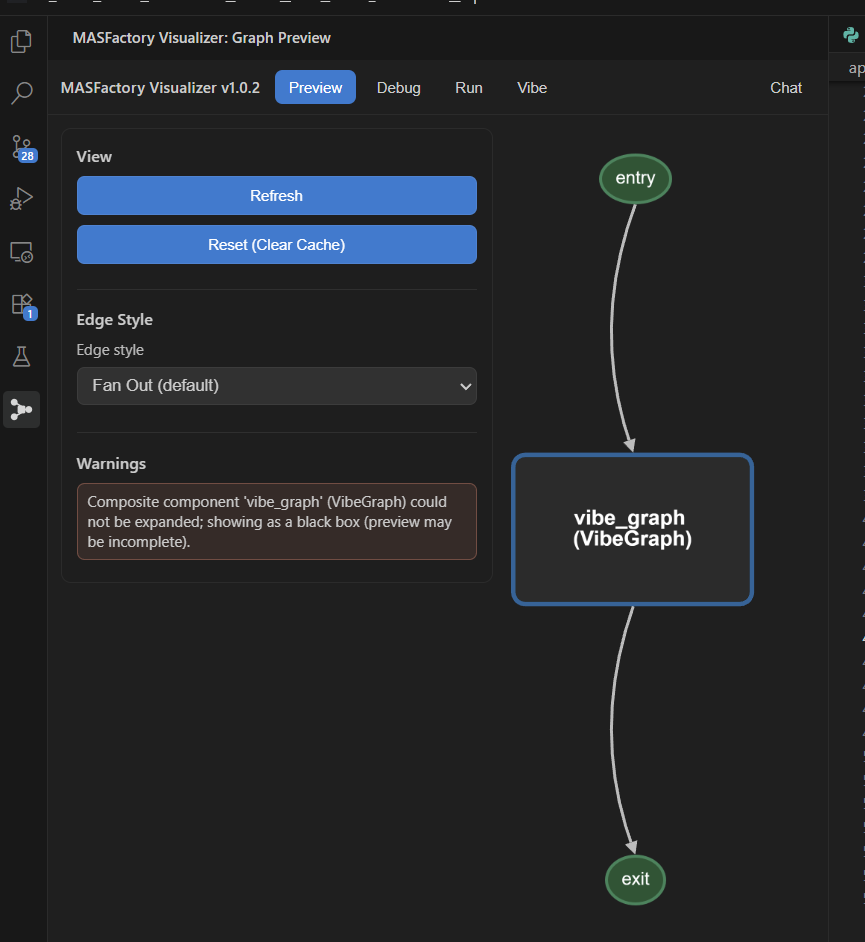
- Preview: Inspect graph topology parsed from Python/JSON (subgraphs, loops, switches, etc.).
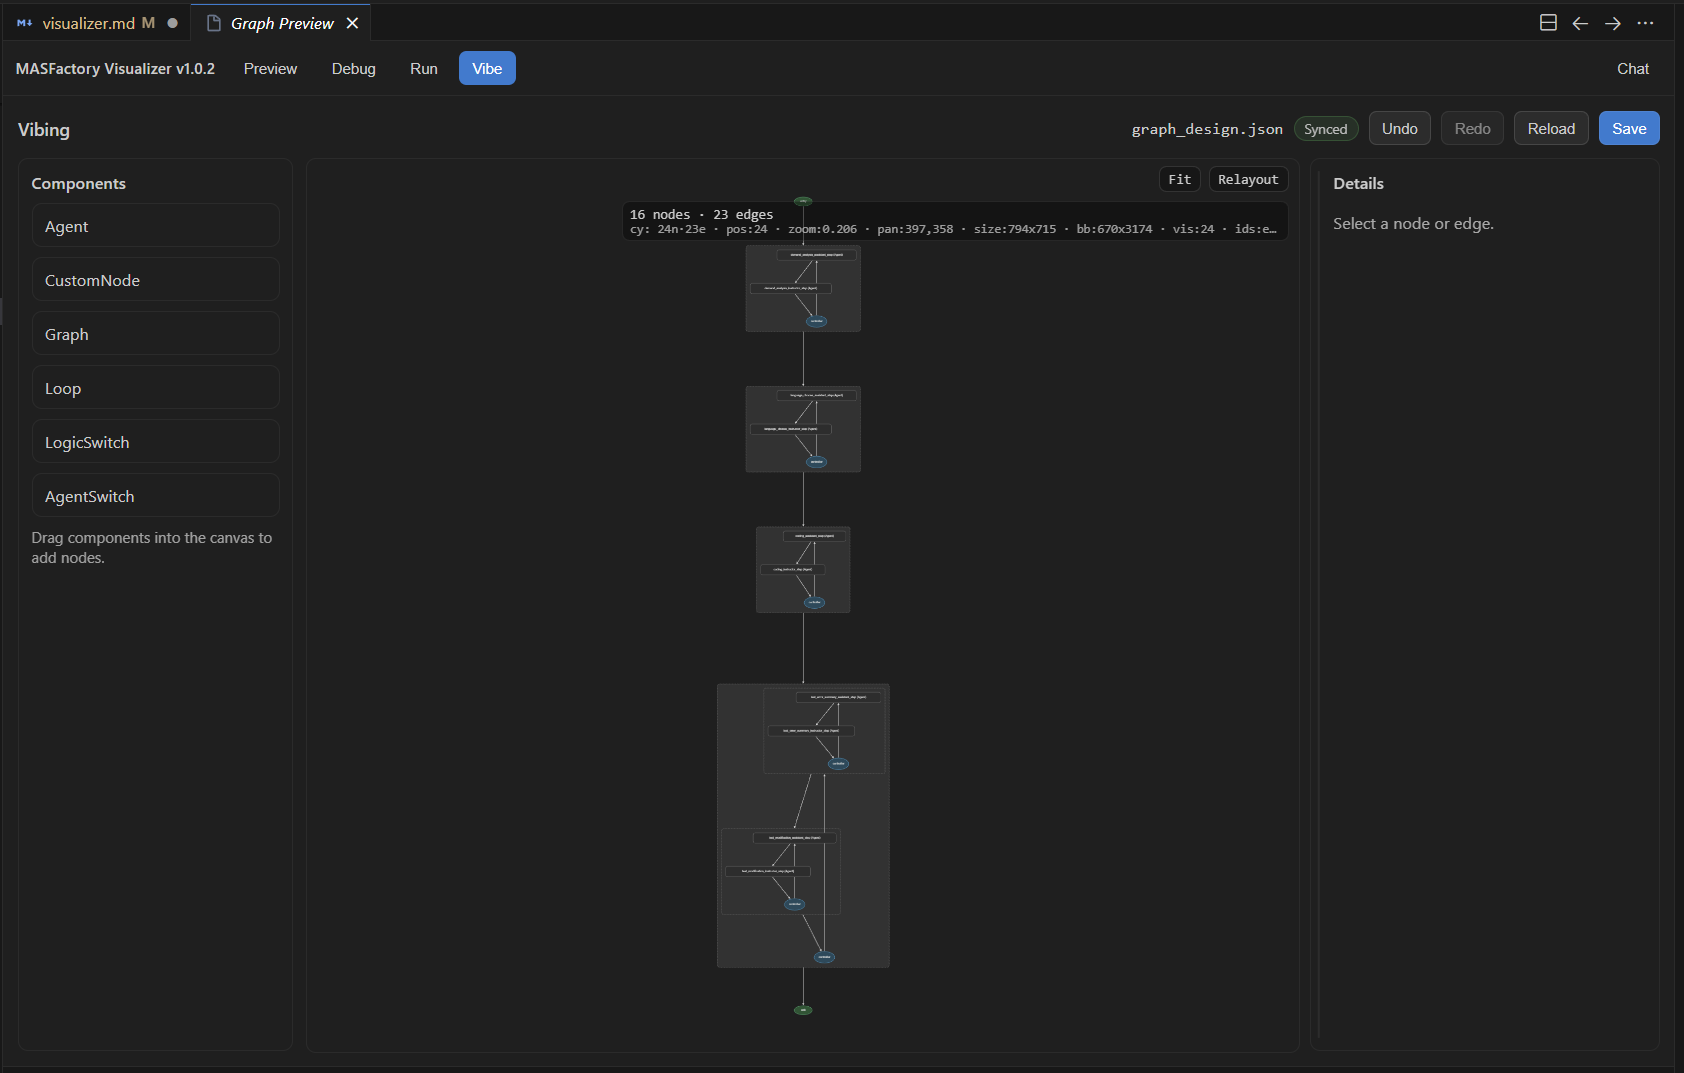
- Vibe: Preview/edit
graph_design.jsonfor VibeGraphing iterations. - Run / Debug: Track node states, message events, and errors at runtime.
- Human-in-the-loop: Receive user requests (chat / file preview & edit) and send replies back to the running process.
Two ways to open it
Visualizer supports two entry points, backed by the same parsing and runtime data source:
- Sidebar (Activity Bar)
Click MASFactory Visualizer in the Activity Bar to open the Graph Preview view.
- Editor Tab (Webview Panel)
Run in Command Palette:
MASFactory Visualizer: Start Graph PreviewMASFactory Visualizer: Open Graph in Editor Tab
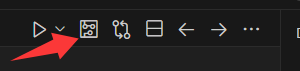
Or click the top-right action button in a .py / .json editor tab:
Typical workflow
- Open a
.pyfile that builds a MASFactory graph; - Open Visualizer and switch to Preview;
- If you use VibeGraphing: generate/update
graph_design.json, then iterate in Vibe; - Run your workflow and inspect Run / Debug for runtime traces and user requests.
For full layout and per-tab functionality, see: Dev Guide · MASFactory Visualizer.