MASFactory Visualizer
This chapter describes MASFactory Visualizer in detail: entry points, UI layout, and the responsibilities of each tab. The goal of Visualizer is to keep the whole loop—structure design → executable assembly → runtime tracing → human-in-the-loop—observable through a consistent graph view.
How to open it
Visualizer provides two entry points. They share the same parsing and runtime data source; choose the one that fits your workflow.
Option A: Sidebar (Activity Bar)
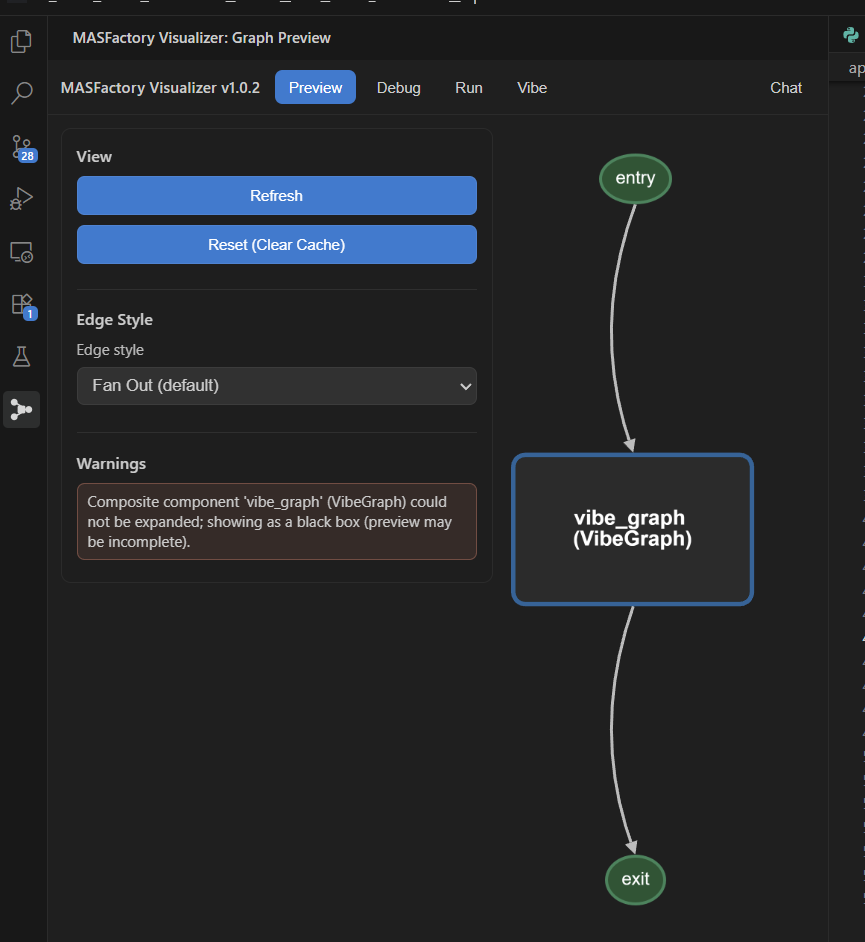
Click MASFactory Visualizer in the Activity Bar to open the Graph Preview sidebar view.
Pros:
- Works well for “code + graph” side-by-side editing;
- Does not consume editor tabs.
Option B: Editor Tab (Webview Panel)
Open via Command Palette:
MASFactory Visualizer: Start Graph PreviewMASFactory Visualizer: Open Graph in Editor Tab
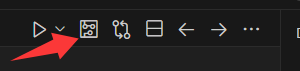
Or click the top-right action button in a .py / .json editor tab:
Pros:
- Larger canvas for complex topologies and runtime traces;
- Can be managed like regular editor tabs.
UI layout
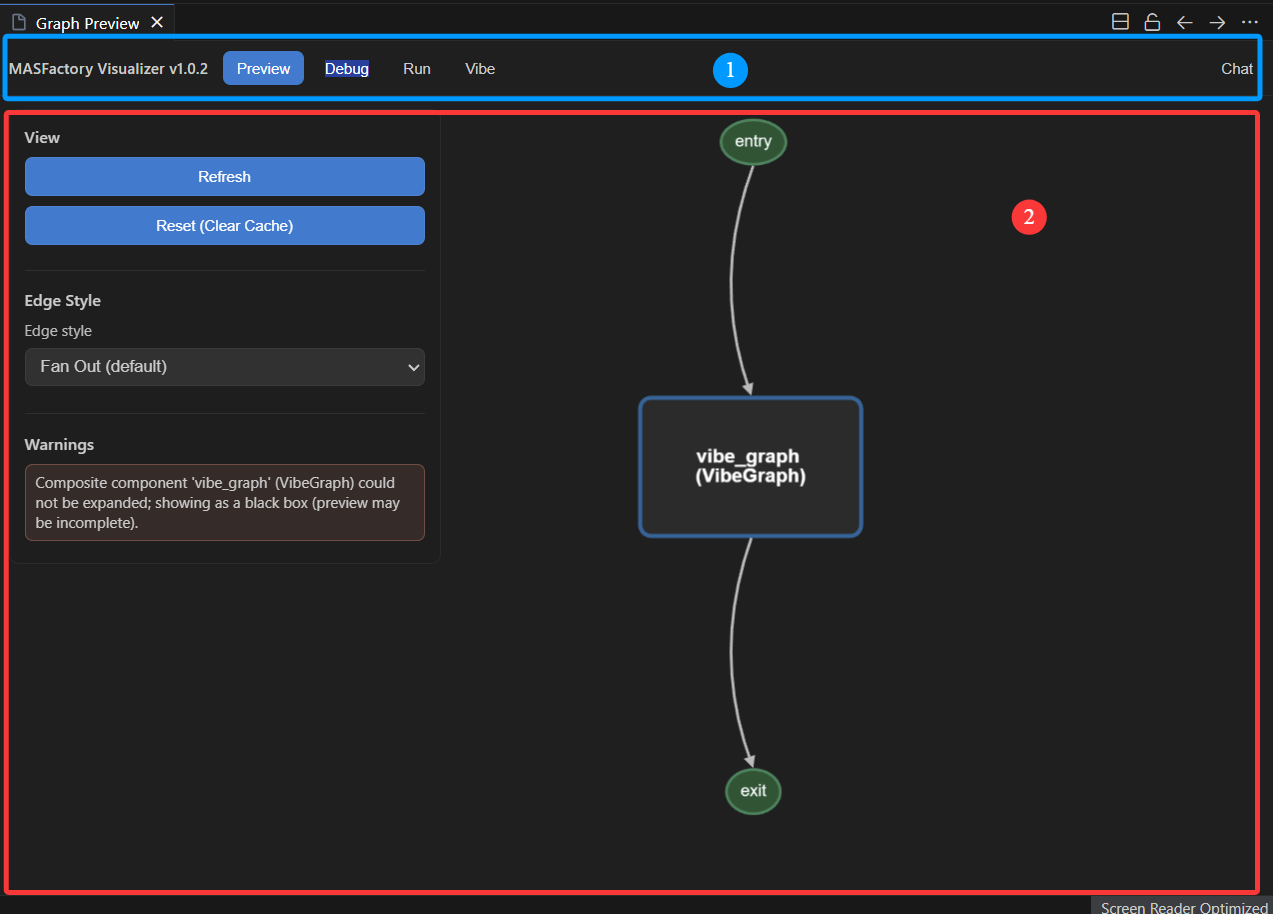
The overall layout can be summarized into four regions:
- Top bar (1): version/title, tabs (Preview / Debug / Run / Vibe), and global entry points (e.g. Chat with badges).
- Main canvas (2): topology rendering of nodes and edges; supports zoom/pan, Fit/Relayout, and drag interactions.
In Run / Debug, an additional bottom info bar appears under the canvas for detailed runtime views (Node / Logs / Messages / Human / System / Graph Structure).
Tabs
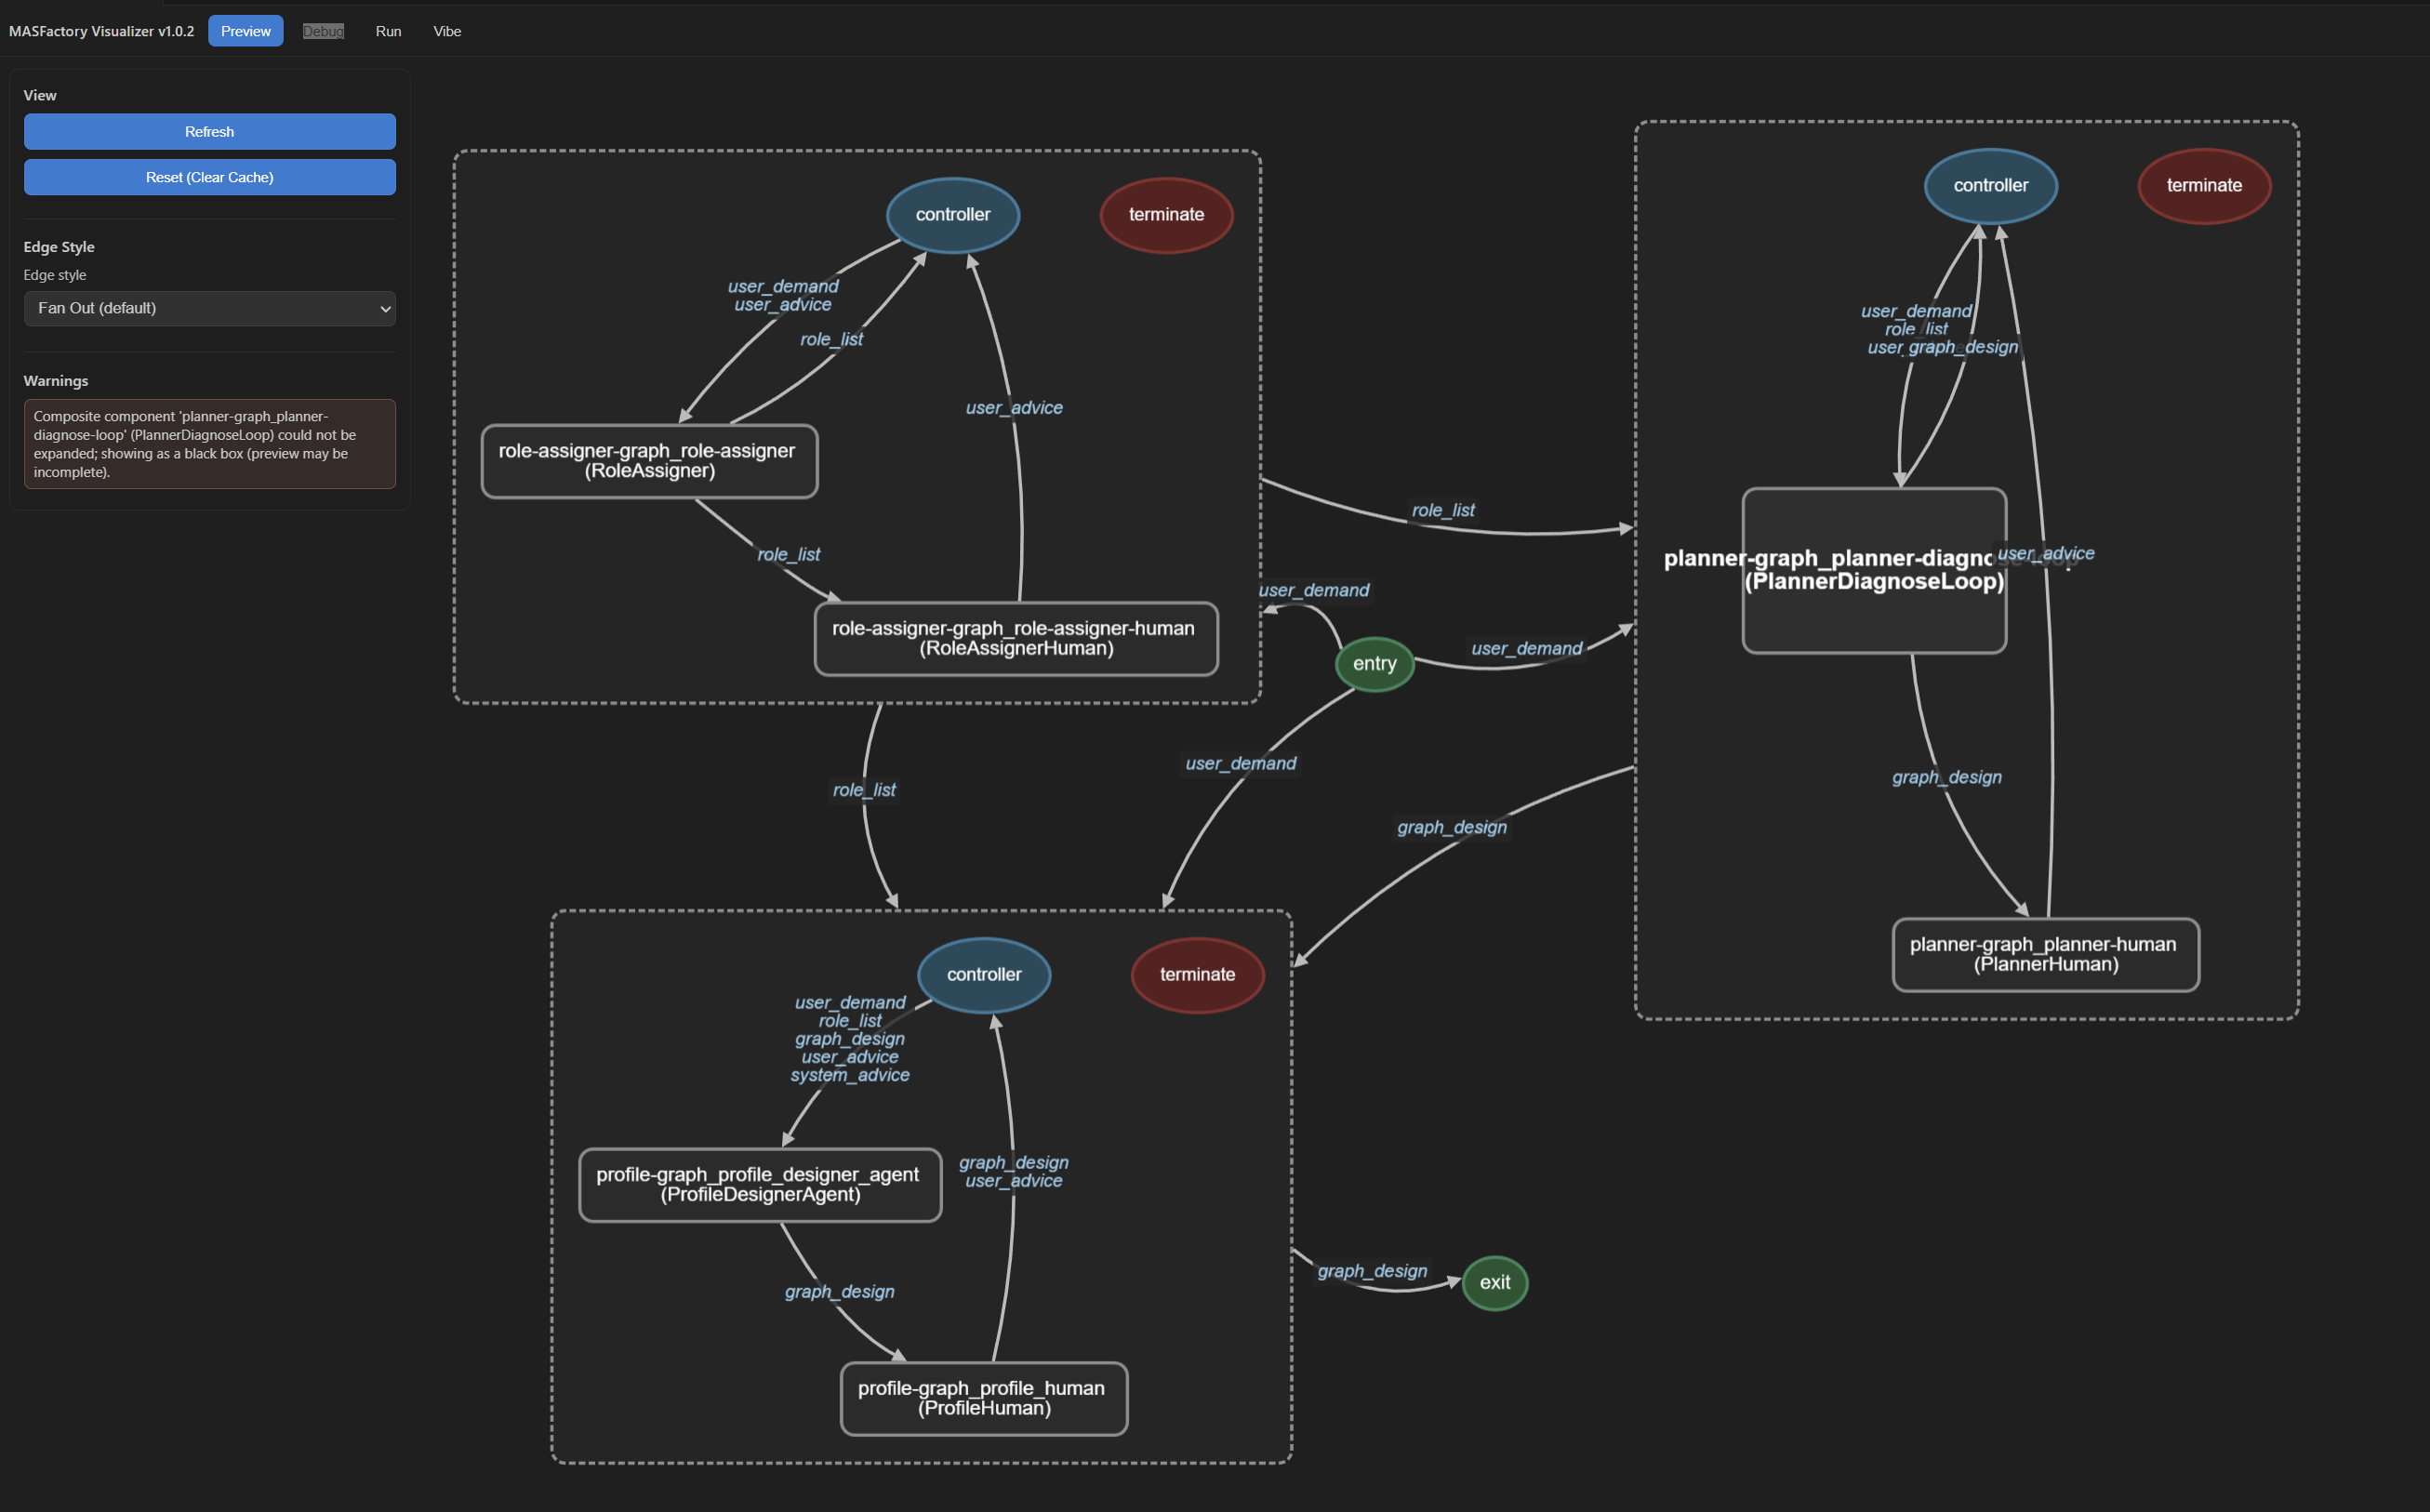
1) Preview: static topology
Use it to:
- Inspect the graph assembled from
.pysources (Graph/NodeTemplate, subgraphs, loops, switches); - Validate structural expectations before running;
- Review node/edge details with a stable, non-runtime view.
Common interactions:
- Double-click a node to jump to the corresponding Python source location.
2) Debug: trace under VS Code Debug sessions
Use it to:
- Correlate execution traces with your VS Code debug sessions;
- Inspect breakpoints/exceptions alongside graph-level execution;
- Locate where the workflow stops, branches, or exits early.
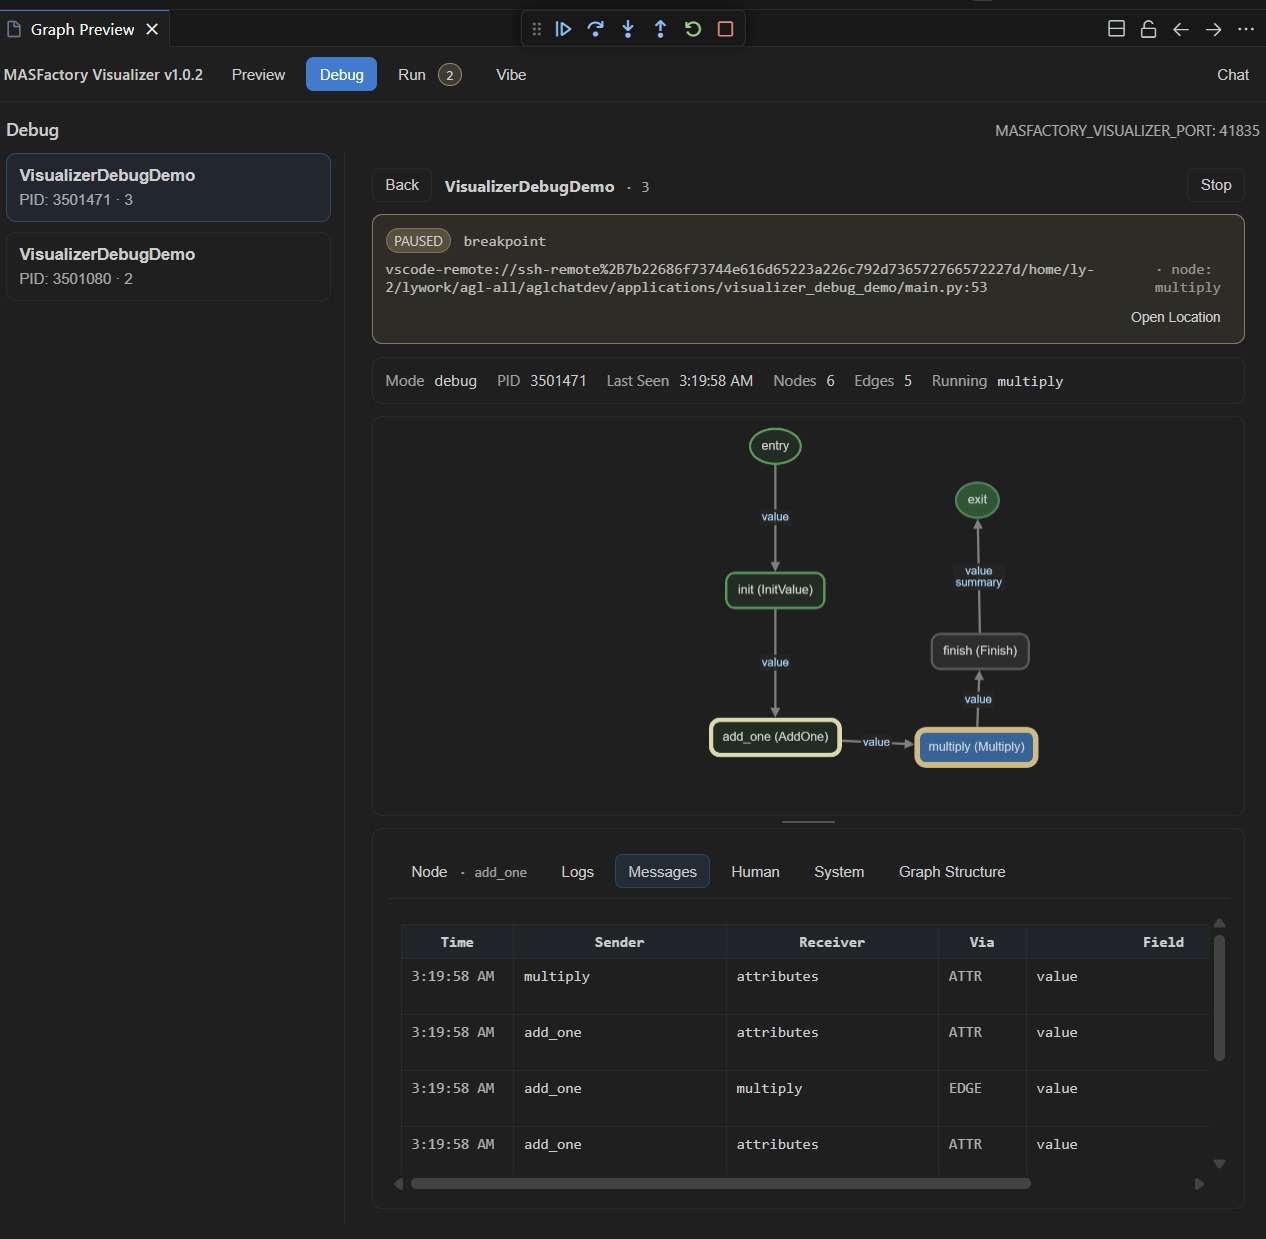
Layout
- Session list (left): browse multiple debug sessions and switch quickly.
- Status bar (top): show key events (breakpoint/exception) and provide a quick jump to source location.
- Canvas (middle): highlight the current execution position and executed trace on the graph.
- Bottom panels (bottom): inspect node details, logs, messages and system events.
3) Run: runtime sessions (non-debug)
Use it to:
- Track running sessions (processes) and their state;
- Inspect node states, message events, and system logs;
- Handle human-in-the-loop requests surfaced by the runtime.
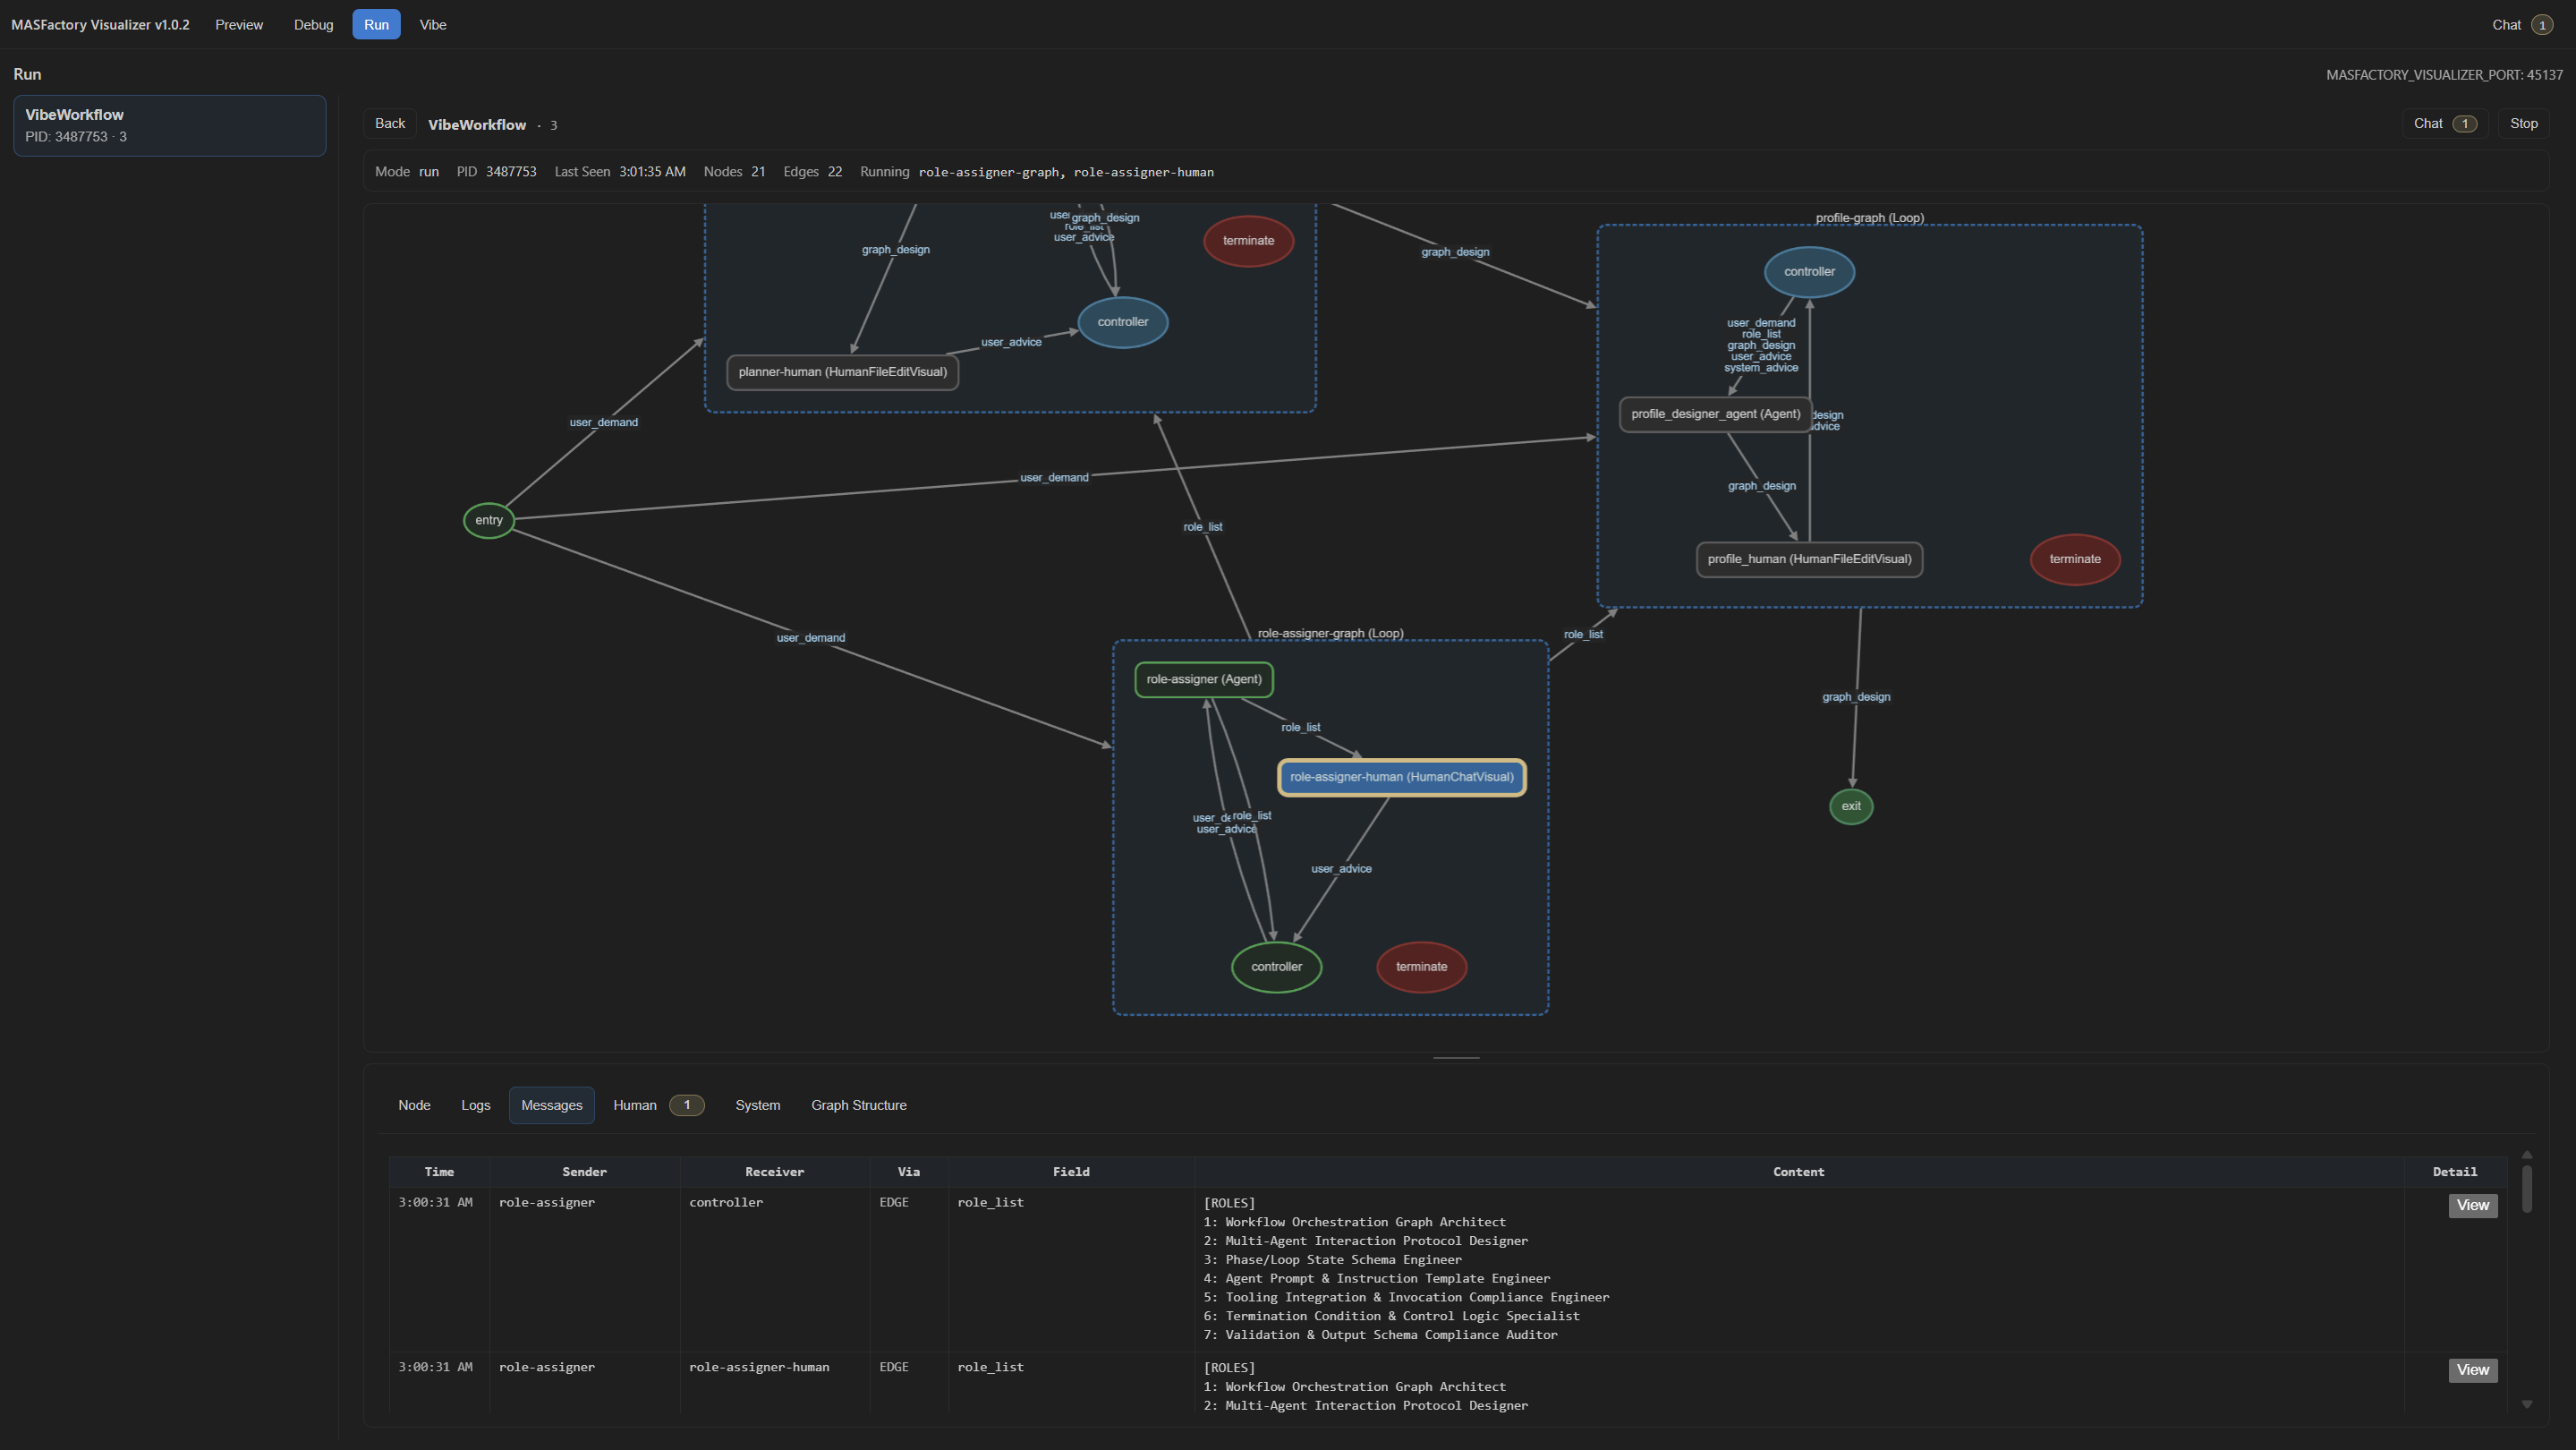
Layout
- Session list (left): manage runtime sessions (processes). Exited sessions are kept for review and can be deleted manually.
- Status bar (top): show mode, PID, last-seen time, node/edge counts, and running state.
- Canvas (middle): render the runtime graph and highlight node states (executed / running / waiting, etc.).
- Bottom panels (bottom): drill into runtime details (nodes, logs, messages, human requests, system events, structure snapshots).
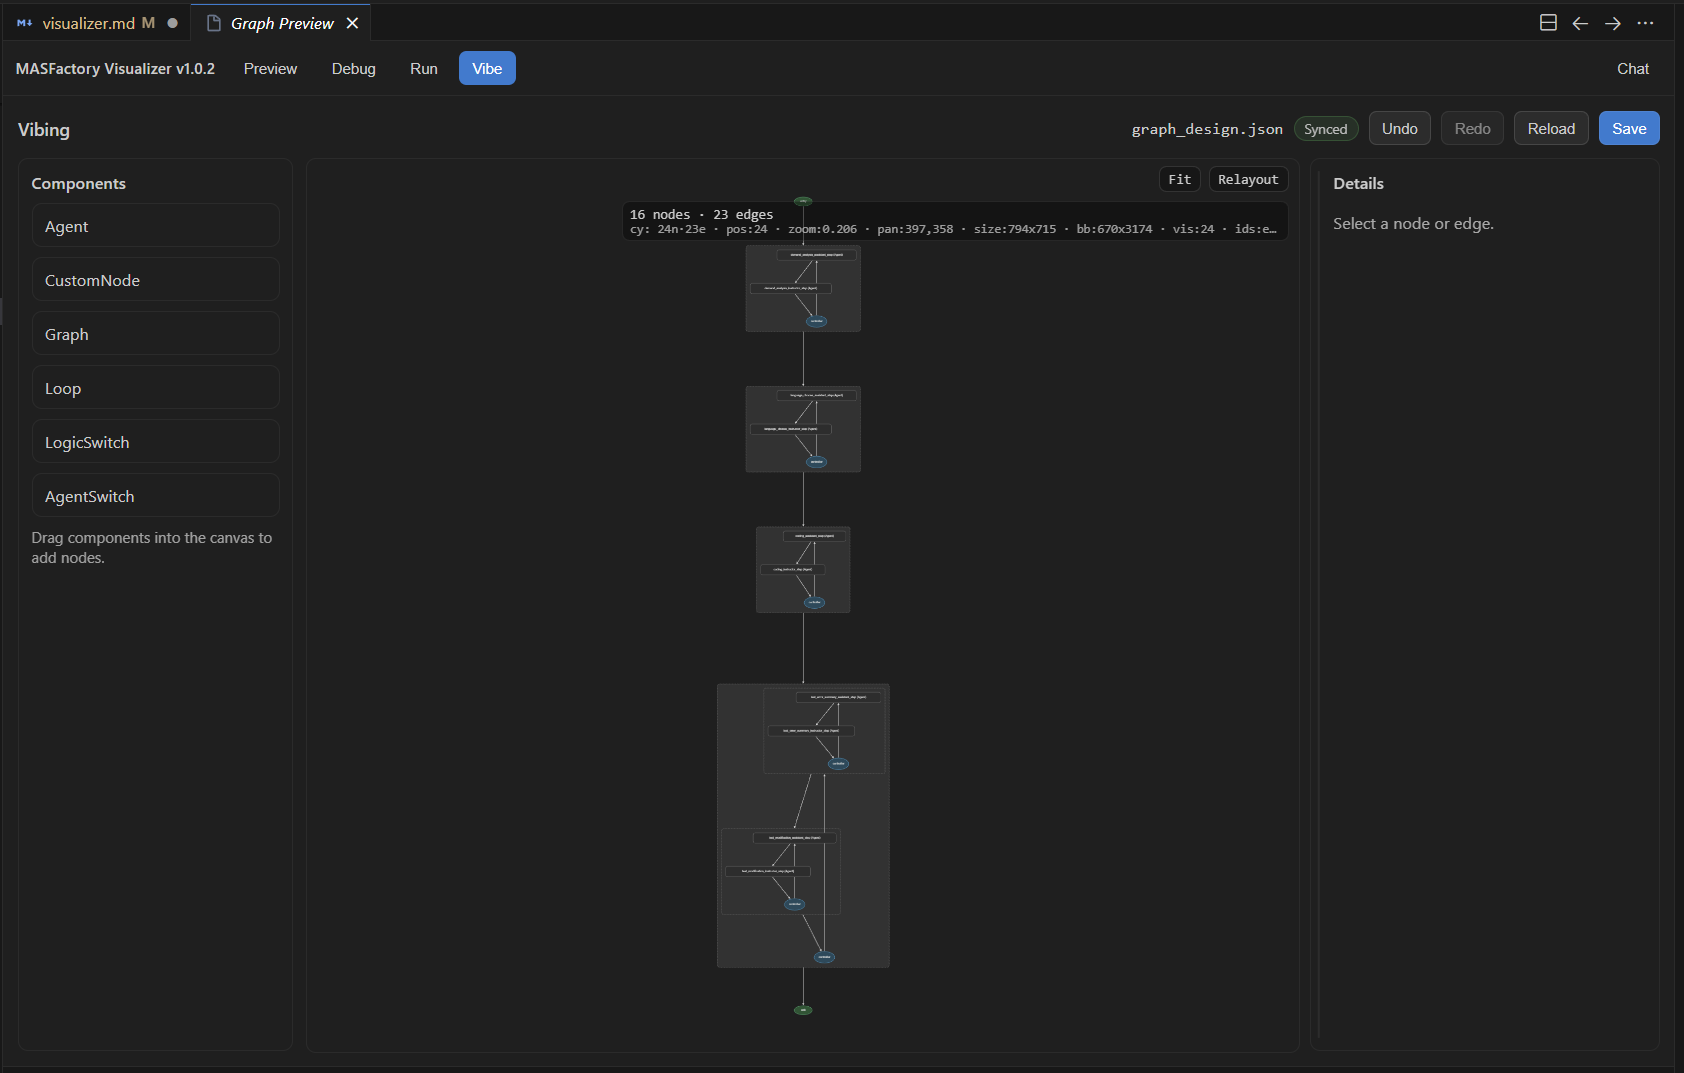
4) Vibe: preview/edit graph_design.json
Use it to:
- Iterate on VibeGraphing outputs (
graph_design.json) and converge structure; - Apply human review before compiling to executable graphs;
- Persist structure changes as a versionable IR.
The graph_design standard is defined under the repository graph_design/ directory.
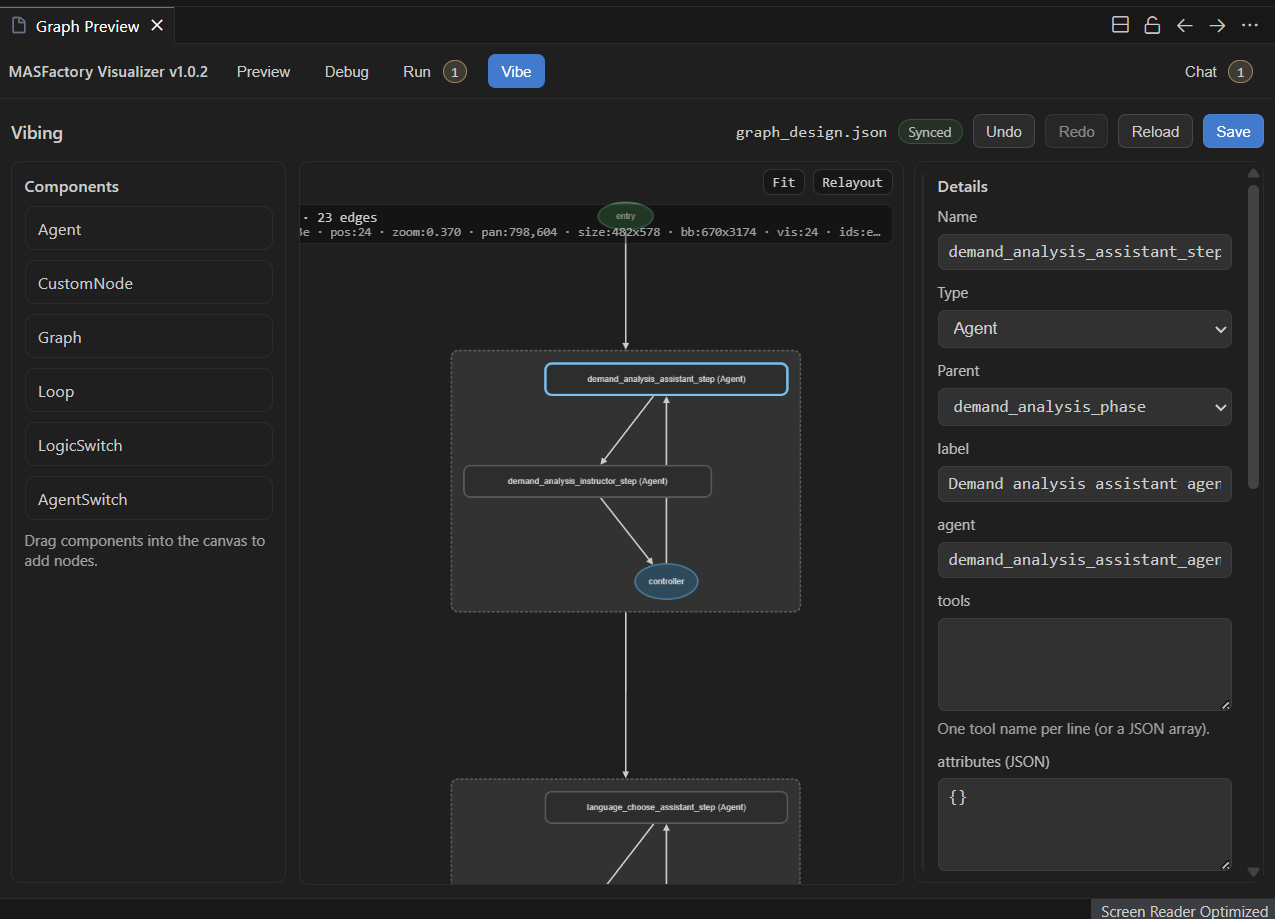
Layout
- Component panel (left): common components (Agent / Graph / Loop / Switch …) and drag-to-add nodes.
- Editor canvas (middle): visualize and edit the
graph_design.jsontopology; supports Fit/Relayout, zoom and drag. - Details panel (right): inspect/edit node/edge properties (type, label, agent, tools, attributes, etc.) and save back to JSON.
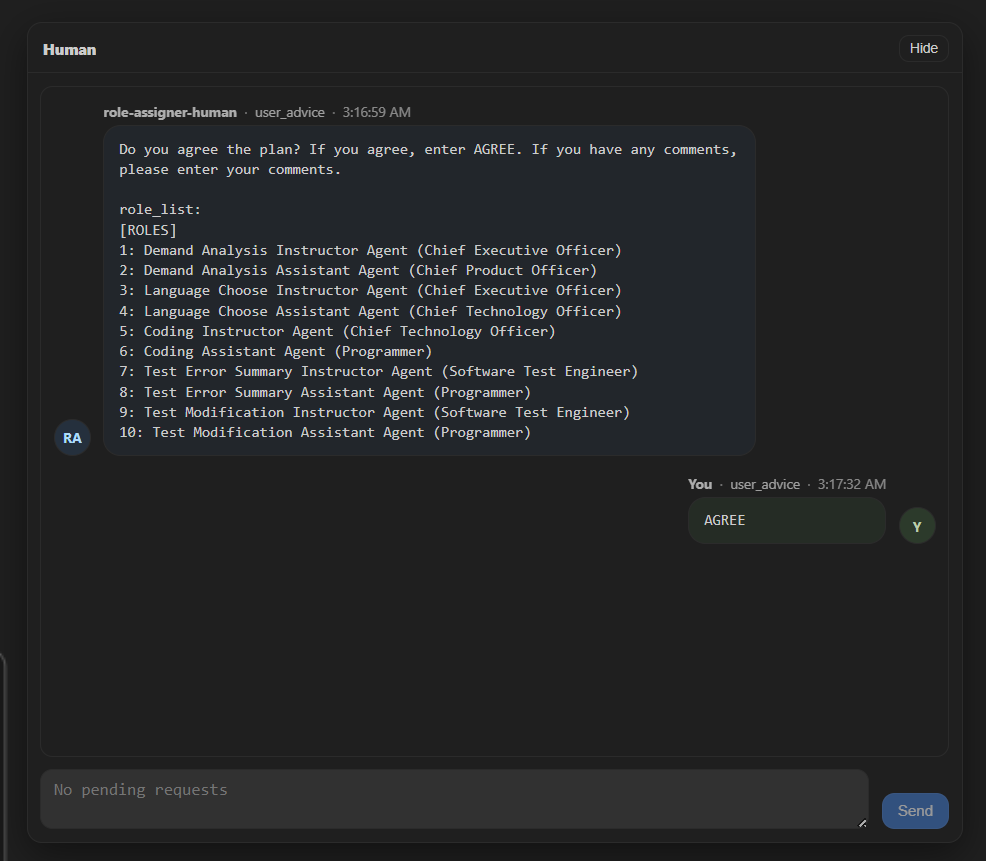
Human-in-the-loop
When a workflow triggers a human request at runtime, Visualizer surfaces it in the UI and provides a reply path back to the process. Typical requests include:
- Chat input: session-scoped conversation history (Agent ↔ Human) and reply submission;
- File preview/edit: open target files in VS Code, and provide a matching preview view in Visualizer (e.g., edit
graph_design.jsonin Vibe).